1
GATE EE 2008
MCQ (Single Correct Answer)
+2
-0.6
The asymptotic Bode magnitude plot of a minimum phase transfer function is shown in the figure:

This transfer function has
2
GATE EE 2007
MCQ (Single Correct Answer)
+2
-0.6
If $$X = {\mathop{\rm Re}\nolimits} G\left( {j\omega } \right),\,\,$$ and $$y = {\rm I}mG\left( {j\omega } \right)$$ then for $$\omega \to {0^ + },\,\,$$ the Nyquist plot for $$G\left( s \right) = 1/\left[ {s\left( {s + 1} \right)\left( {s + 2} \right)} \right]$$
3
GATE EE 2006
MCQ (Single Correct Answer)
+2
-0.6
The Bode magnitude plot of $$H\left( {j\omega } \right) = {{{{10}^4}\left( {1 + j\,\omega } \right)} \over {\left( {10 + j\,\omega } \right){{\left( {100 + j\omega } \right)}^2}}}$$ is
A

B

C

D

4
GATE EE 2006
MCQ (Single Correct Answer)
+2
-0.6
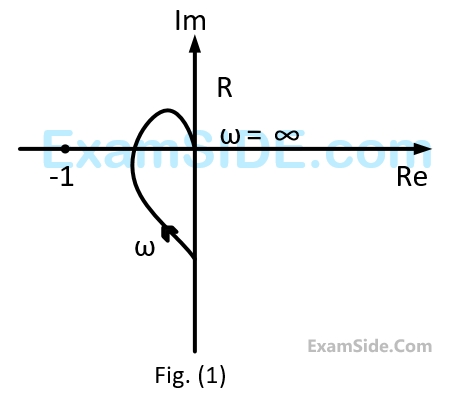
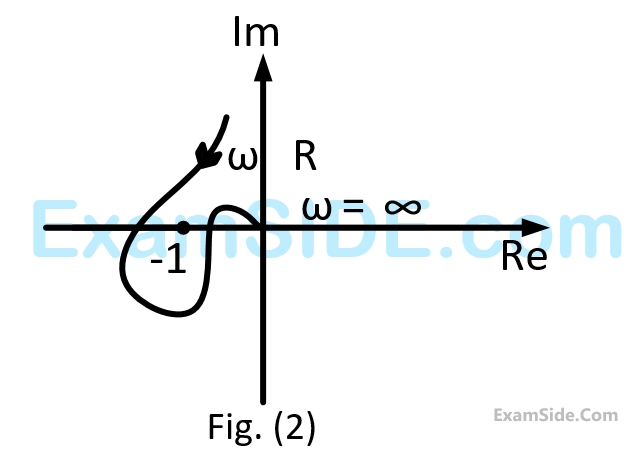
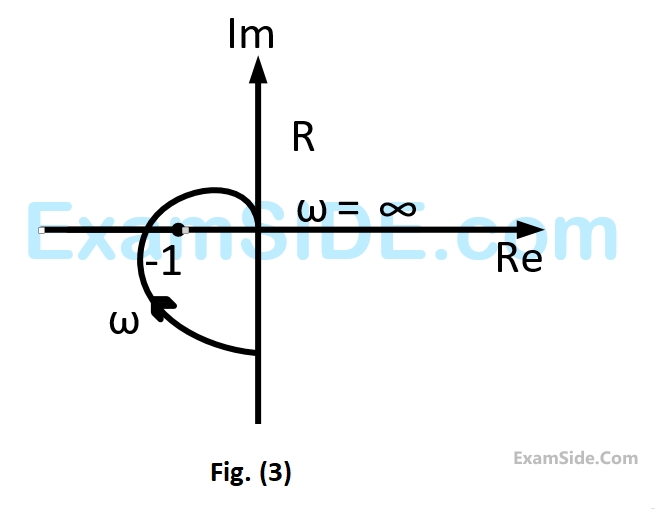
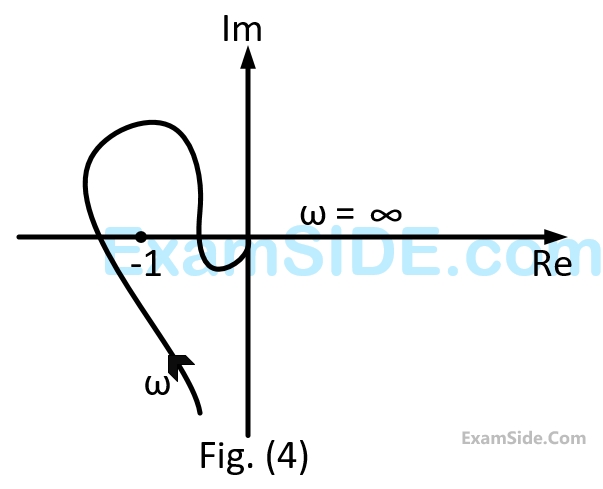
Consider the following Nyquist plots of loop transfer functions over $$\omega = 0$$ to $$\omega = \infty .$$ Which of these plots represents a stable closed loop system?
GATE EE Subjects
Browse all chapters by subject
Electric Circuits
Electrical Machines
Engineering Mathematics
Signals and Systems
Power Electronics
Power System Analysis
Digital Electronics
Analog Electronics
Electromagnetic Fields
Control Systems
Electrical and Electronics Measurement
General Aptitude