Marks 1
1
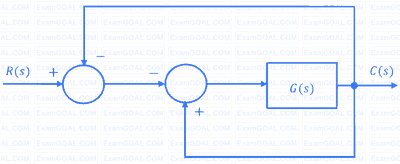
For the block-diagram shown in the figure, the transfer function $\frac{C(s)}{R(s)}$ is
GATE EE 2024
2
For the block diagram shown in the figure, the transfer function $${{Y(s)} \over {R(s)}}$$ is

GATE EE 2023
3
$$ \text { For the closed-loop system shown, the transfer function } \frac{E(s)}{R(s)} \text { is } $$

GATE EE 2021
4
For the signal-flow graph shown in the figure, which one of the following expressions is equal to the transfer function $${\left. {{{Y\left( s \right)} \over {{X_2}\left( s \right)}}} \right|_{{x_1}\left( s \right) = 0}}?$$

GATE EE 2015 Set 1
5
The signal flow graph of a system is shown below. $$U(S)$$ is the input and $$C(S)$$ is the output.

Assuming $${h_1} = {b_1}$$ and $${h_0} = {b_0} - {b_1}{a_1},$$ the input-output transfer function, $$G\left( S \right) = {{C\left( S \right)} \over {U\left( S \right)}}$$ of the system is given by
GATE EE 2014 Set 3
6
Signal flow graph is used to obtain the
GATE EE 1993
7
The overall transfer function of the system in Figure, is

GATE EE 1992
Marks 2
1
In the system whose signal flow graph is shown in the figure, $${{U_1}\left( s \right)}$$ and $${{U_2}\left( s \right)}$$ are inputs. The transfer function $${{Y\left( s \right)} \over {{U_1}\left( s \right)}}\,$$ is

GATE EE 2017 Set 1
2
Find the transfer function $${{Y\left( s \right)} \over {X\left( s \right)}}$$ of the system given below:

GATE EE 2015 Set 1
3
The block diagram of a system is shown in the figure

If the desired transfer function of the system is $${{C\left( s \right)} \over {R\left( s \right)}}\, = {s \over {{s^2} + s + 1}},$$ then $$G(s)$$ is
GATE EE 2014 Set 3
4
The signal flow graph for a system is given below. The transfer function $${{Y\left( s \right)} \over {U\left( s \right)}}$$ for this system is

GATE EE 2013
5
The system shown in figure below

can be reduced to the form
With
can be reduced to the form
With
GATE EE 2007
6
For the block diagram shown in figure, the transfer function $${{C\left( s \right)} \over {R\left( s \right)}}$$ is equal to

GATE EE 2004
7
The block diagram of a control system is shown in Fig. The transfer function $$G(s) = Y(s)/U(s)$$ of the system is

GATE EE 2003
8
For block diagram shown in Figure $$C(s)/R(s)$$ is given by

GATE EE 1998
9
The signal flow graph of Fig. shown below, has ___________ forward paths / and ________feed - back loops.

GATE EE 1991