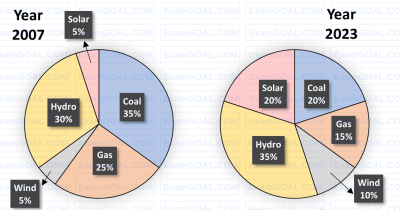
The pie charts depict the shares of various power generation technologies in the total electricity generation of a country for the years 2007 and 2023.

The renewable sources of electricity generation consist of Hydro, Solar and Wind. Assuming that the total electricity generated remains the same from 2007 to 2023, what is the percentage increase in the share of the renewable sources of electricity generation over this period?
A rectangular paper sheet of dimensions 54 cm × 4 cm is taken. The two longer edges of the sheet are joined together to create a cylindrical tube. A cube whose surface area is equal to the area of the sheet is also taken.
Then, the ratio of the volume of the cylindrical tube to the volume of the cube is
The pie chart presents the percentage contribution of different macronutrients to a typical 2,000 kcal diet of a person.
Macronutrient energy contribution

The typical energy density (kcal/g) of these macronutrients is given in the table:
| Macronutrient | Energy density (kcal/g) |
|---|---|
| Carbohydrates | 4 |
| Proteins | 4 |
| Unsaturated fat | 9 |
| Saturated fat | 9 |
| Trans fat | 9 |
The total fat (all three types), in grams, this person consumes is
A rectangular paper of 20 cm × 8 cm is folded 3 times. Each fold is made along the line of symmetry, which is perpendicular to its long edge. The perimeter of the final folded sheet (in cm) is