The mean rainfall over a catchment has to be estimated. The data for four rain gauges located in and around the catchment is listed in the table. Which one of the following statements is correct:
$$ \begin{array}{|l|c|c|c|c|} \hline \text { Rain gauge station } & \text { P } & \text { Q } & \text { R } & \text { S } \\ \hline \text { Whether located inside the catchment } & \text { Yes } & \text { Yes } & \text { Yes } & \text { No } \\ \hline \text { Thiessen weightage factor } & 0.25 & 0.50 & 0.10 & 0.15 \\ \hline \text { Rainfall (mm) } & 100 & 110 & 100 & 125 \\ \hline \end{array} $$A storm with a recorded precipitation of 11.0 cm, as shown in the table, produced a direct run-off of 6.0 cm.
| Time from start (hours) | 1 | 2 | 3 | 4 | 5 | 6 | 7 | 8 |
|---|---|---|---|---|---|---|---|---|
| Recorded cumulative precipitation (cm) | 0.5 | 1.5 | 3.1 | 5.5 | 7.3 | 8.9 | 10.2 | 11.0 |
The Ø-index of this storm is ______________ cm/hr (rounded off to 2 decimal places).
The ordinates of a 1-hour unit hydrograph (UH) are given below.
| Time (hours) | 0 | 1 | 2 | 3 | 4 | 5 |
|---|---|---|---|---|---|---|
| Ordinates of 1-hour UH (m3/s) | 0 | 13 | 50 | 80 | 95 | 85 |
| Time (hours) | 6 | 7 | 8 | 9 | 10 | 11 |
|---|---|---|---|---|---|---|
| Ordinates of 1-hour UH (m3/s) | 55 | 35 | 15 | 10 | 3 | 0 |
These ordinates are used to derive a 3-hour UH. The peak discharge (in m3/s) for the derived 3-hour UH is ___________ (rounded off to the nearest integer).
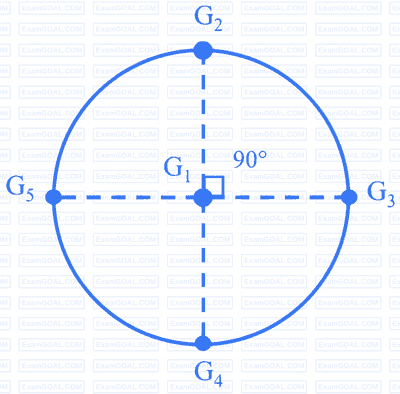
A catchment may be idealized as a circle of radius 30 km. There are five rain gauges, one at the center of the catchment and four on the boundary (equi-spaced), as shown in the figure (not to scale).
The annual rainfall recorded at these gauges in a particular year are given below.
$$ \begin{array}{|l|l|l|l|l|l|} \hline \text { Gauge } & \mathrm{G}_1 & \mathrm{G}_2 & \mathrm{G}_3 & \mathrm{G}_4 & \mathrm{G}_5 \\ \hline \text { Rainfall }(\mathrm{mm}) & 910 & 930 & 925 & 895 & 905 \\ \hline \end{array} $$
Using the Thiessen polygon method, what is the average rainfall (in mm, rounded off to two decimal places) over the catchment in that year? ________
