Signal Flow Graph and Block Diagram · Control Systems · GATE ECE
Marks 1
1
A control system is shown in the Figure.
Which option represents the correct transfer function of the system?

GATE ECE 2026
2
The block diagram of a feedback control system is shown in the figure. The overall closed-loop gain G of the system is

GATE ECE 2016 Set 3
3
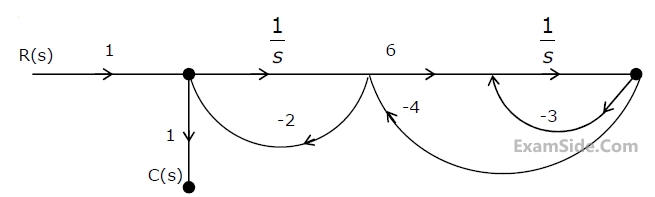
For the signal flow graph shown in the figure, the value of $$\frac{\mathrm C\left(\mathrm s\right)}{\mathrm R\left(\mathrm s\right)}$$ is

GATE ECE 2015 Set 2
4
By performing cascading and/or summing/differencing operations using transfer function
blocks G1(s) and G2(s), one CANNOT realize a transfer function of the form
GATE ECE 2015 Set 2
5
For the following system,
 When X1(s) = 0 , the transfer function $$\frac{\mathrm Y\left(\mathrm s\right)}{{\mathrm X}_2\left(\mathrm s\right)}$$ is
When X1(s) = 0 , the transfer function $$\frac{\mathrm Y\left(\mathrm s\right)}{{\mathrm X}_2\left(\mathrm s\right)}$$ is
GATE ECE 2014 Set 2
6
Consider the following block diagram in the figure.
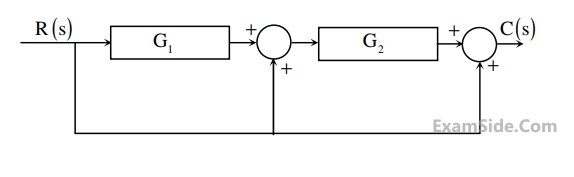 The transfer function $$\frac{\mathrm C\left(\mathrm s\right)}{\mathrm R\left(\mathrm s\right)}$$ is
The transfer function $$\frac{\mathrm C\left(\mathrm s\right)}{\mathrm R\left(\mathrm s\right)}$$ isGATE ECE 2014 Set 3
7
The transfer function Y(s)/R(s) of the system shown is
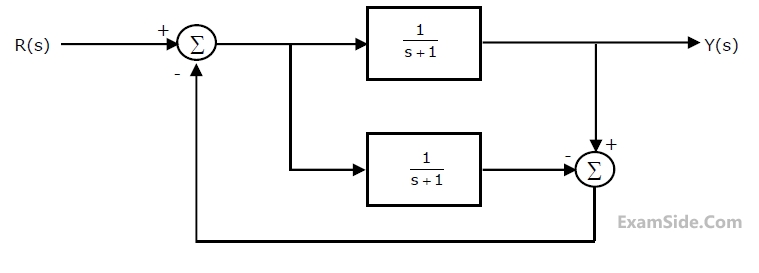
GATE ECE 2010
8
The equivalent of the block diagram in Figure is given as

GATE ECE 2001
9
Signal flow graph is used to find
GATE ECE 1995
Marks 2
1
Consider a system represented by the block diagram shown below. Which of the following signal flow graphs represent(s) this system? Choose the correct option(s).

GATE ECE 2025
2
In the following block diagram, R(s) and D(s) are two inputs. The output Y(s) is expressed as Y(s) = G$$_1$$(s)R(s) + G$$_2$$(s)D(s).
G$$_1$$(s) and G$$_2$$(s) are given by

GATE ECE 2023
3
The block diagram of a feedback control system is shown in the figure. $$ \text { The transfer function } \frac{Y(s)}{X(s)} \text { of the system is } $$
GATE ECE 2021
4
The signal flow graph for a system is given below. The transfer function $$\frac{Y(s)}{U(s)}$$ for this system is

GATE ECE 2013
5
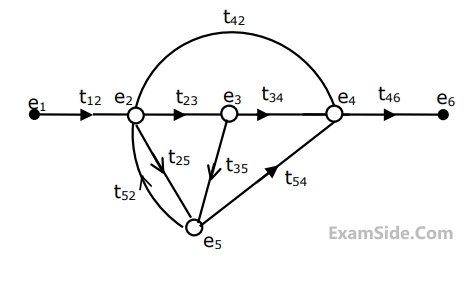
Consider the signal flow graph shown in Figure. The gain $$\frac{x_5}{x_1}$$ is

GATE ECE 2004
6
The signal flow graph of a system is shown in figure. The transfer function $$\frac{C(s)}{R(s)}$$ of the system is
GATE ECE 2003
7
An electrical system and its signal-flow graph representations are shown in Figure
(a) and (b) respectively. The values of G2 and H, respectively are

GATE ECE 2001
8
In the signal flow graph of Fig. y/x equals

GATE ECE 1997
9
In the signal flow graph of Figure, the gain c/r will be

GATE ECE 1991
10
For the system shown in figure the transfer function $$\frac{\mathrm C\left(\mathrm s\right)}{\mathrm R\left(\mathrm s\right)}$$ is equal to

GATE ECE 1987
11
In the signal flow graph shown in fig X2= TX1 where T is equal to

GATE ECE 1987
Marks 5
1
A feedback control system is shown in figure
 (a) Draw the signal-flow graph that represents the system.
(b) Find the total number of loops in the graph and determine the loop-gains of all the loops.
(c) Find the number of all possible combination of non-touching loops taken two at a time.
(d) Determine the transfer function of the system using the signal-flow graph.
(a) Draw the signal-flow graph that represents the system.(b) Find the total number of loops in the graph and determine the loop-gains of all the loops.
(c) Find the number of all possible combination of non-touching loops taken two at a time.
(d) Determine the transfer function of the system using the signal-flow graph.
GATE ECE 2001
2
Draw a signal flow graph for the following set of algebraic equations:
$$$\begin{array}{l}y_2=ay_1-\;gy_3\\y_3=ey_2+\;cy_4\\y_4=by_2-dy_4\end{array}$$$
Hence, find the gains $$\frac{y_2}{y_1}$$ and $$\frac{y_3}{y_1}$$.
GATE ECE 1998
3
Reduce the signal flow graph shown in fig. below, to obtain another graph which does not contain the node e5.Also, remove any self-loop from the resulting graph.
GATE ECE 1994